First, we learned to obtain satellite imagery and how the files are named on the glovis.usgs.gov website. It’s pretty straightforward, with the names following a Sensor type, Path and Row number, and date in the form of year and the Julian date. Of course, other sources of data may have different methods of naming the data files.
We
also learned how to unzip these specific types of files, which are downloaded
in a *.tar.gz format. I use this type of file quite often, and this is fairly simple to unzip, you just use the 7-Zip
software on the file twice.
The second part of the lab involved learning about different types of spatial enhancement in both Imagine and ArcGIS. I found this really interesting because it gave me a better understanding of what exactly occurs when you use a high or low pass filter. It's used a lot when performing research in meteorology, so I already had a basic understanding of it, but this lab explains it well and is very useful, especially seeing the calculations being performed when using the filters.
We learned about high pass filters, which allow high frequency data (data that changes rapidly from pixel to pixel) to pass through, but suppresses low frequency date (data that doesn't change much from pixel to pixel). This has the effect of enhancing edges or discrete features, or to sharpen an image. We also learned about low pass filters, which allow low frequency data but suppress high frequency data, which has the effect of blurring or "smoothing" an image. I also learned how to use the Focal Statistics tool in ArcMap, specifically the "Mean" and "Range" filters. The Mean filter is a low pass filter, but it uses as 7x7 kernel instead of a 3x3 kernel, which results in each new cell being the average of a larger area, so the result is a more generalized image. I immediately thought in terms of resolution -- the results from the 7x7 kernel having a more coarse resolution than those from the 3x3 kernel. The Range statistic is similar to Edge Detect, It gives each new cell a value showing the difference in brightness between neighboring pixels, which is called spatial frequency. So, if you have a border or an edge, the spatial frequency will be high and it will show up brighter on imagery. The interiors of an area will be darker as they will have a lower spatial frequency due to the similarity of the surrounding pixels.
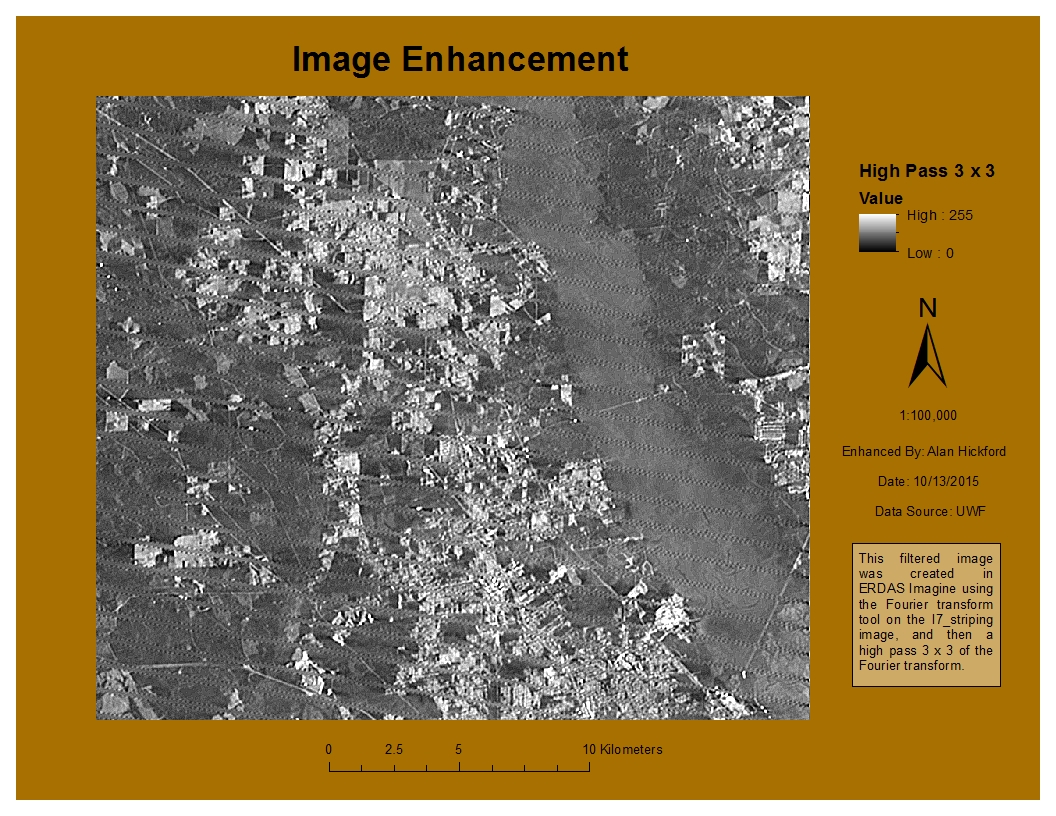
The third part was the main focus of the lab. We were to take an image and perform an enhancement on it that reduced the effect of the striping in the image, but also retain most of the detail. I performed a Fourier transform on the image using Imagine, which reduced some of the striping. I then used a 3x3 Sharpen kernel on the image to sharpen the features. I really enjoyed working with the Fourier transform tool. I have seen it used in statistics and research, but never actually worked with it before (outside of mathematics). It wasn't too complicated to perform the transformation with Imagine, and I used it in my final enhancement image. I created multiple enhancements using various techniques as I tried to determine which worked best for this image. I started with a 5x5 low pass enhancement, which made the image quite a bit more blurry as expected. I tried a Sobel 3x3 edge enhancement, which did leave most of the detail intact but also left the striping. I tried a 3x3 horizontal kernel, which distorted the image and made it grainy. I also tried a 5x5 Summary, which wasn't too bad; again, it left the detail but also the striping. What I finally did was to use a Fourier transform but with a larger circle. The smaller the circle here, the more pronounced the low pass filter will be, and the image would be blurry. A larger circle mitigated that effect. From here, I used a 3x3 high pass filter, which gave a detailed image while also reducing the effect the striping has on the image. From there, I added the image into ArcMap and created my map. I wanted to show the image at 1:100,000 scale so that the effects of the enhancements can be seen.
No comments:
Post a Comment